
6 Month Project Timeline with KPI Template
SKU10280SKU20280
For personal and commercial use
Category:
About this template
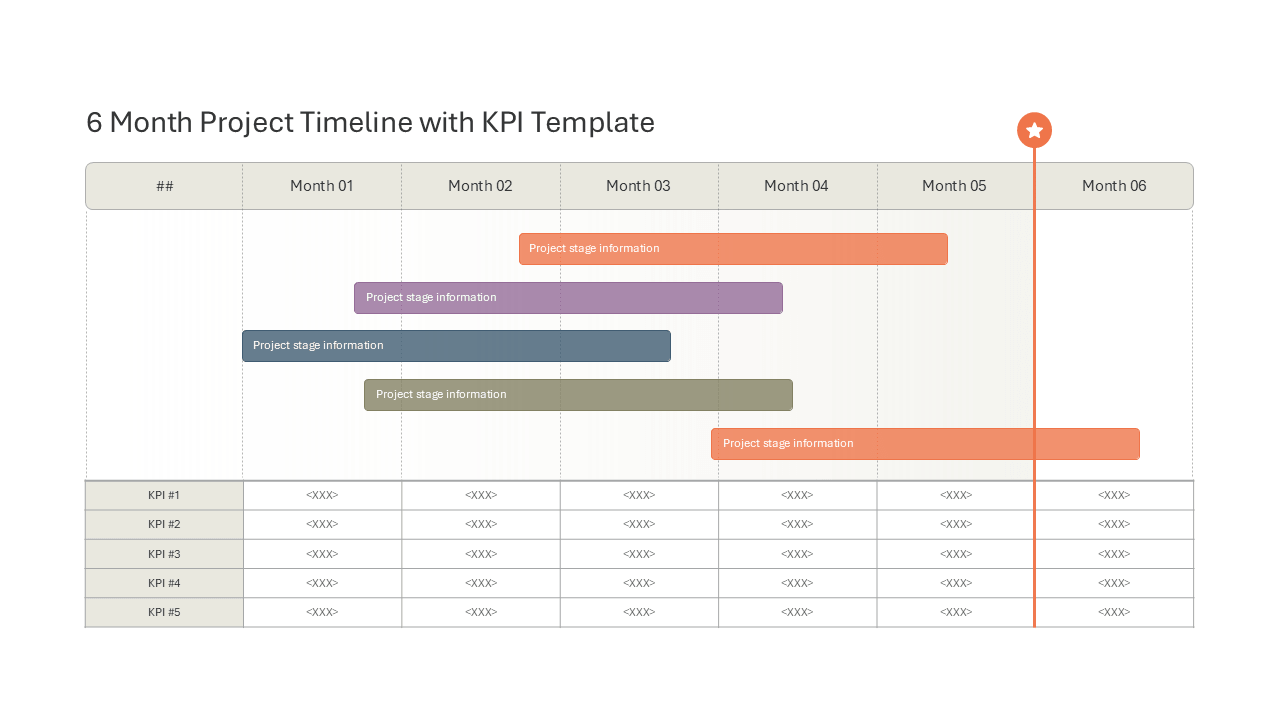
This slide combines a six-month Gantt chart with a KPI table in one view, so schedule and metrics are read together. Five colour-coded bars span the Month 01 to Month 06 columns at different start and end points, and each bar has a text label for a project stage. A vertical line with a star marks a milestone or the current date. Below, five KPI rows each have a value cell for every month. Use it for project plans, half-year roadmaps, status reviews and progress reports. Titles, labels, bar positions and lengths, colours and table values can all be edited.