
Agile Project Process Repeated Iterations Gantt Chart Budget Timeline
SKU10343SKU20343
For personal and commercial use
Category:
About this template
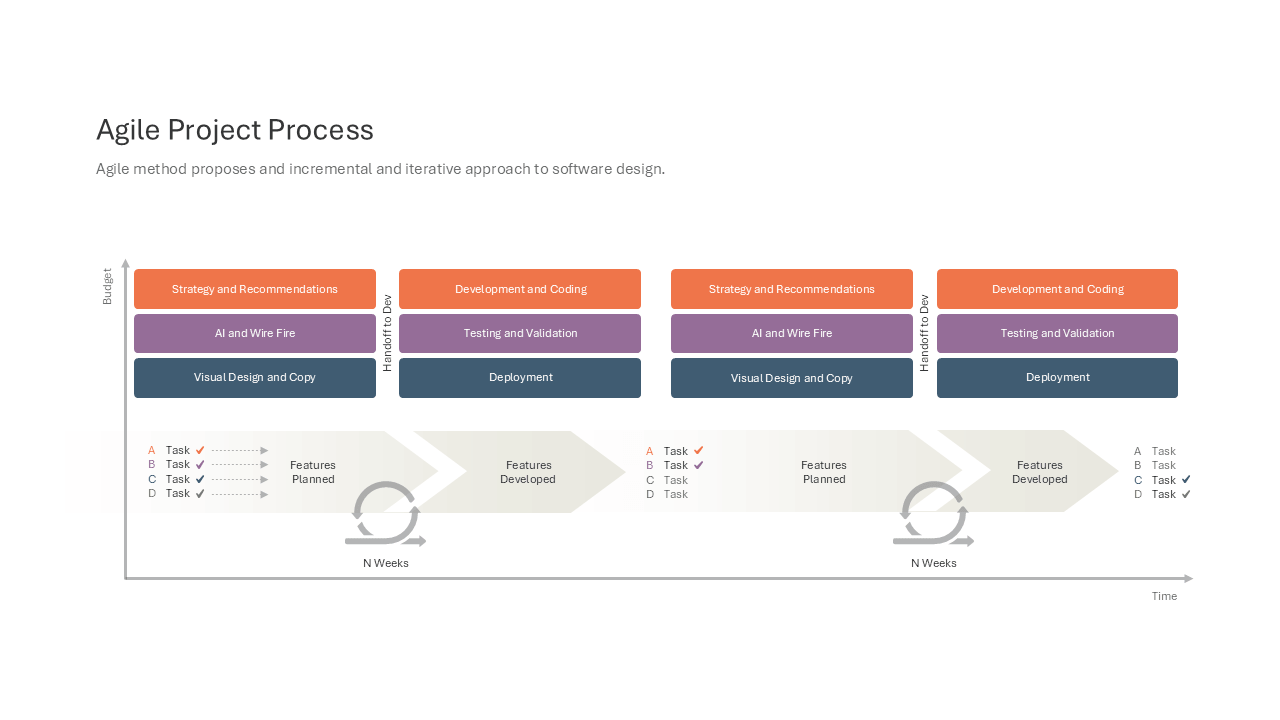
This slide shows an agile process as two repeated iterations on a chart with a Time axis and a Budget axis, rather than a single linear flow. Each iteration has six colour-coded stage boxes in two columns, from Strategy and Recommendations to Deployment, linked by a Handoff to Dev label. Chevron arrows for Features Planned and Features Developed sit below, with a cycle icon and an N Weeks label and task rows A to D with check marks. Use it to explain iterative software design, sprint planning, or the handoff from design to development. Stage names, task labels, week counts and colours can all be edited.