
Perceptual Mapping Template
SKU10566SKU20566
For personal and commercial use
Category:
About this template
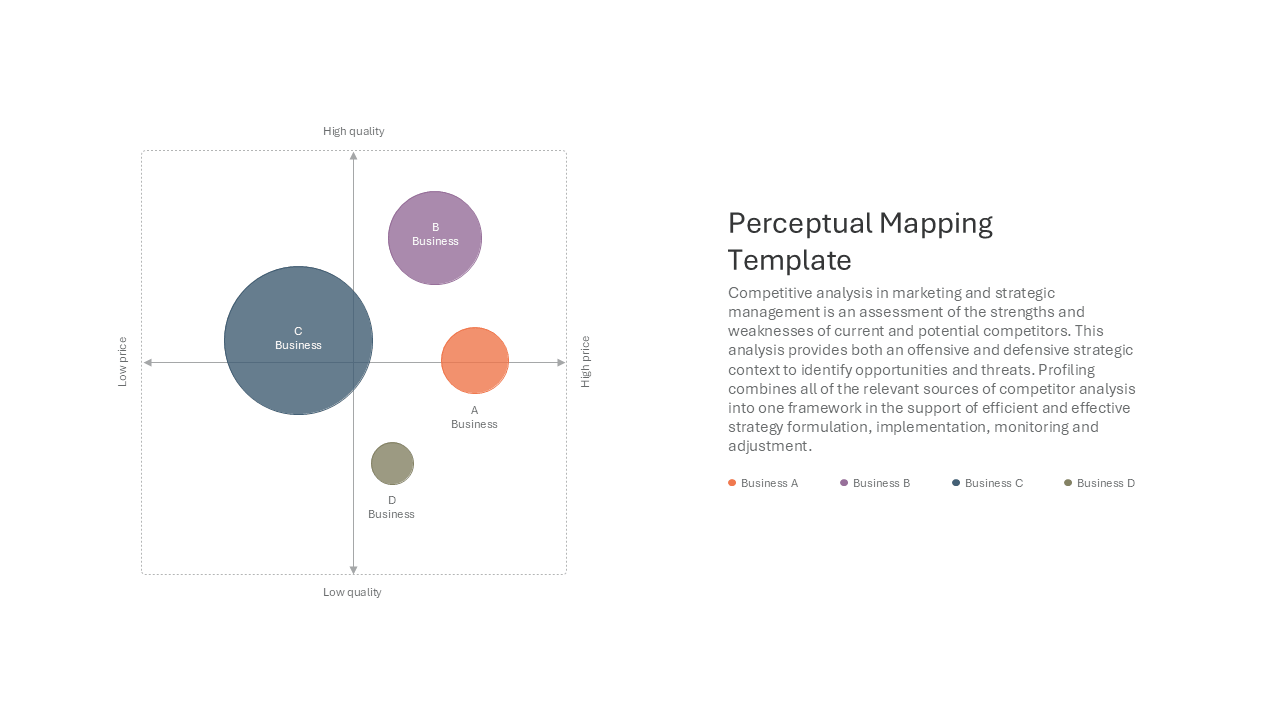
This slide plots four businesses as differently sized, colour-coded bubbles on a price and quality grid, so competitor positions and a third measure can be read at once. The vertical axis runs from low to high quality and the horizontal axis from low to high price. A title, a paragraph on competitive analysis and a four-colour legend sit beside the chart. Use it for competitor positioning, brand comparison and market analysis in strategy or marketing reviews. Axis labels, business names, bubble sizes and positions, colours and text can all be edited to fit your own market data.