
Project Management KPI Dashboard Template
SKU10281SKU20281
For personal and commercial use
Category:
About this template
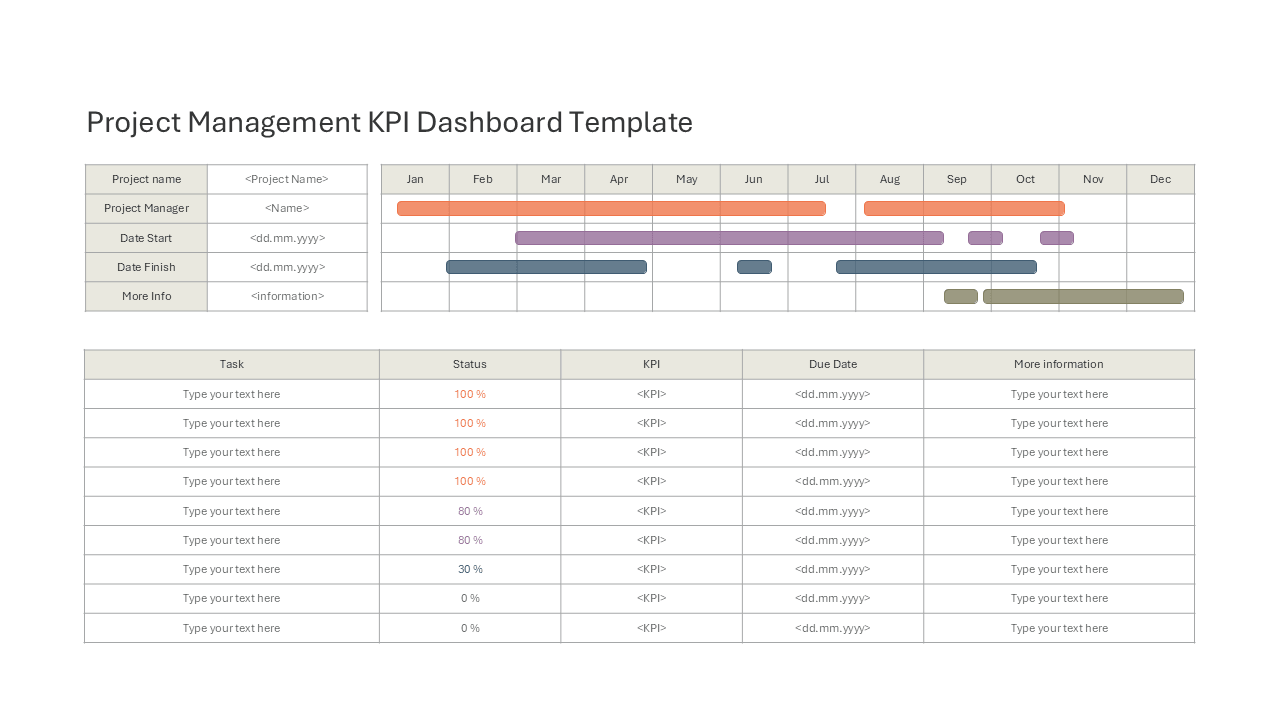
This slide puts a project details block, a 12-month Gantt-style timeline and a task KPI table on one page. The top left block lists project name, project manager, start date, finish date and more info. Next to it, colored bars across the Jan to Dec grid show when each stream of work runs. The lower table has nine task rows with columns for task, status percentage, KPI, due date and more information. Use it for project status reports, KPI reviews and progress updates. All text, dates, percentages and bar lengths and colors can be edited to match your project.