
Visualizing the Crisis Process as a Phase Model
SKU10584SKU20584
For personal and commercial use
Category:
About this template
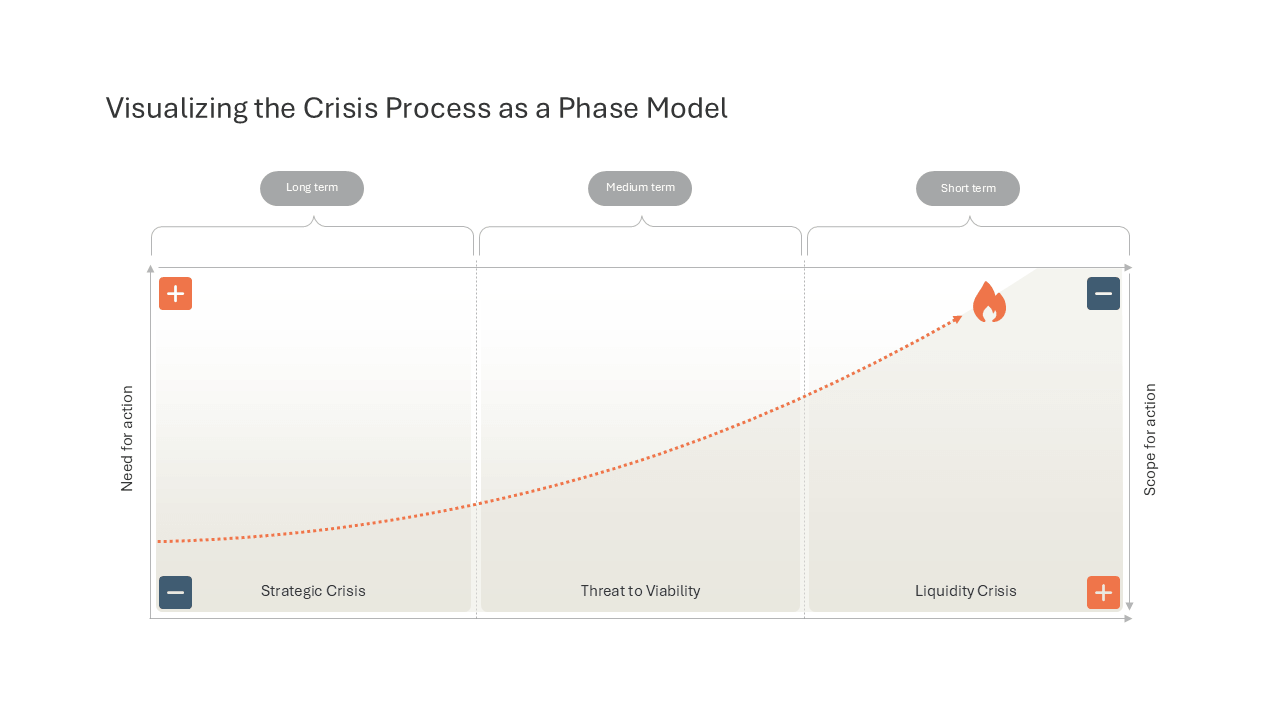
This slide shows a crisis as three consecutive phases on one chart, with a dotted curve that climbs from left to right and ends at a flame icon. The phases are Strategic Crisis, Threat to Viability and Liquidity Crisis, each in its own shaded panel and tagged long, medium or short term with a brace and label. The left axis shows need for action and the right axis shows scope for action, with plus and minus markers at the corners. Use it in crisis management, restructuring and risk briefings to explain how options narrow as urgency grows. All text labels, shapes and colours can be edited.