
Year Project Timeline with KPI Template
SKU10279SKU20279
For personal and commercial use
Category:
About this template
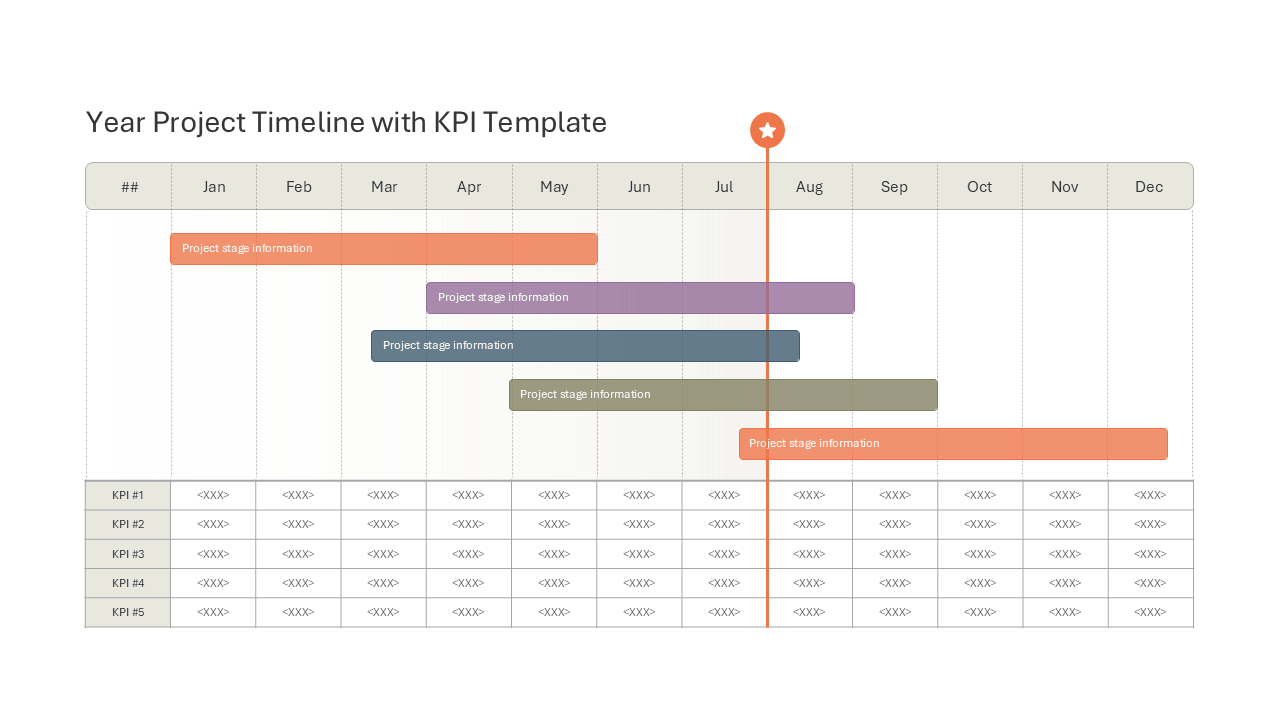
This slide combines a 12-month Gantt chart with a monthly KPI table on one page, so schedule and metrics are read together. Five colored bars show project stages that start and end in different months and overlap. A vertical line with a star marks a milestone or the current date. Under the chart, five KPI rows have a value cell for every month from January to December. Use it for annual project plans, roadmaps, status reviews and KPI reporting. Stage labels, KPI names, values, bar lengths, colors and the marker position can all be edited.